In my previous post, I briefly overviewed Dataform in BigQuery. Now that your Dataform project is mature enough to support business decisions, it’s time to try something new and build a machine learning anomaly detection pipeline with BigQuery ML. Let’s assume that you already store a number of daily sign-ups and payments in BigQuery. You want to get a notification if there is an unusual drop or a spike in any of these metrics.
For the sake of simplicity, I will use these additional assumptions:
- all the data flow stays inside the BigQuery so you don’t need to manage any external dependencies
- the decision-making model stays up to date with the ingestion of new data
- no manual model tuning
- anomalies are tracked on a previous date and not in real-time
BigQuery ML has built-in support for time series forecasting and anomaly detection. You will use both of them in the pipeline and add some Dataform features on top of that. The process will be as follows:
- Prepare the data as a temporary table
- Train the model
- Detect anomalies
- Check if the most recent data points are anomalies
Prepare the data as a temporary table
Let’s define a bounded period for our model to work with. You can set a variable for this with the default number of days in the past. I will use 91 here:
DECLARE period_start DATE DEFAULT DATE_SUB(CURRENT_DATE(), INTERVAL 91 DAY);
Next, you can create a separate table with the training data for your model and reference it in your Dataform queries. But I will use a temporary table here to store all the model-related SQL queries in a single SQLX file and separate this file into several steps for better debugging. Here is an example that combines two data aggregations up to the current date into a single table:
CREATE OR REPLACE TEMP TABLE RAW_DATA AS (
  SELECT
    *
  FROM (
    SELECT
      payment_date AS event_date,
      COUNT(*) AS value,
      'payment' AS id
    FROM
      ${ref('payments')}
    WHERE
      payment_date >= period_start
      AND payment_date < CURRENT_DATE()
    GROUP BY
      event_date)
  UNION ALL (
    SELECT
      sign_up_date AS event_date,
      COUNT(*) AS value,
      'sign_up' AS id
    FROM
      ${ref('users')}
    WHERE
      sign_up_date >= period_start
      AND sign_up_date < CURRENT_DATE()
    GROUP BY
      event_date)
  ORDER BY
    id,
    event_date
);
We set different ids for each metric in this query. You will use these ids in the next step. Also, I reference some dependencies here with Dataform ${ref()} function, so these dependencies must exist for this query to run successfully.
Train the model
To train the model, use the following query with my_dataset replaced with the dataset name. There are many additional options, but I’ll stick to defaults with most of them. Set TIME_SERIES_DATA_COL to a column with metrics values, and TIME_SERIES_TIMESTAMP_COL to a column with dates.
You have two metrics here, so by setting TIME_SERIES_ID_COL to a column with time series ids you will instruct BigQuery to train a separate model for each metric. It means you can train hundreds or even thousands of models in a single query if you prepare the data accordingly. How cool that is, right?
I also set the data frequency to daily and cut the forecasting horizon to 7 days because we will not use this model for forecasting.
CREATE OR REPLACE MODEL my_dataset.trials_anomalies_detection
 OPTIONS(
   MODEL_TYPE = 'arima_plus',
   TIME_SERIES_DATA_COL = 'value',
   TIME_SERIES_TIMESTAMP_COL = 'event_date',
   DATA_FREQUENCY = 'DAILY',
   HORIZON = 7,
   TIME_SERIES_ID_COL = 'id' )
 AS (SELECT * FROM RAW_DATA);
Detect anomalies
For our toy example, it will take several minutes for BigQuery ML to train both models. When the models are ready, use the following query to detect anomalies:
SELECT
  id,
  DATE(event_date) AS event_date,
  value,
  is_anomaly,
  lower_bound,
  upper_bound,
  anomaly_probability
FROM
  ML.DETECT_ANOMALIES(
    MODEL my_dataset.trials_anomalies_detection
    )
I cast the event_date field to date type to use it as a partition field later. Here is the entire Dataform SQLX file with the config part:
config {
  type: "table",
  description: "Anomalies data on main metrics",
  columns:{
    id: 'Metric name',
    event_date:	'Event date',
    value: 'Metric value',
    is_anomaly: 'Indicates whether the value at a specific date is an anomaly: true if it is, false otherwise',
    lower_bound: 'Lower bound for value estimation at a specific date',
    upper_bound: 'Upper bound for value estimation at a specific date',
    anomaly_probability: 'Indicates the probability that this point is an anomaly'
  },
  bigquery:{
    partitionBy: "event_date",
    labels: {
      "stage": "beta",
      "source": "dataform"
      }
  },
  tags: ["1d"]
}

pre_operations {
  DECLARE  period_start DATE DEFAULT DATE_SUB(CURRENT_DATE(), INTERVAL 91 DAY);
  CREATE OR REPLACE TEMP TABLE RAW_DATA AS (
  SELECT
    *
  FROM (
    SELECT
      payment_date AS event_date,
      COUNT(*) AS value,
      'payment' AS id
    FROM
      ${ref('payments')}
    WHERE
      payment_date >= period_start
      AND payment_date < CURRENT_DATE()
    GROUP BY
      event_date)
  UNION ALL (
    SELECT
      sign_up_date AS event_date,
      COUNT(*) AS value,
      'sign_up' AS id
    FROM
      ${ref('users')}
    WHERE
      sign_up_date >= period_start
      AND sign_up_date < CURRENT_DATE()
    GROUP BY
      event_date)
  ORDER BY
    id,
    event_date);

 CREATE OR REPLACE MODEL my_dataset.trials_anomalies_detection
  OPTIONS(
    MODEL_TYPE = 'arima_plus',
    TIME_SERIES_DATA_COL = 'value',
    TIME_SERIES_TIMESTAMP_COL = 'event_date',
    DATA_FREQUENCY = 'DAILY',
    HORIZON = 7,
    TIME_SERIES_ID_COL = 'id' )
  AS (SELECT * FROM RAW_DATA);
}

SELECT
  id,
  DATE(event_date) AS event_date,
  value,
  is_anomaly,
  lower_bound,
  upper_bound,
  anomaly_probability
FROM
  ML.DETECT_ANOMALIES(
    MODEL my_dataset.trials_anomalies_detection
    )
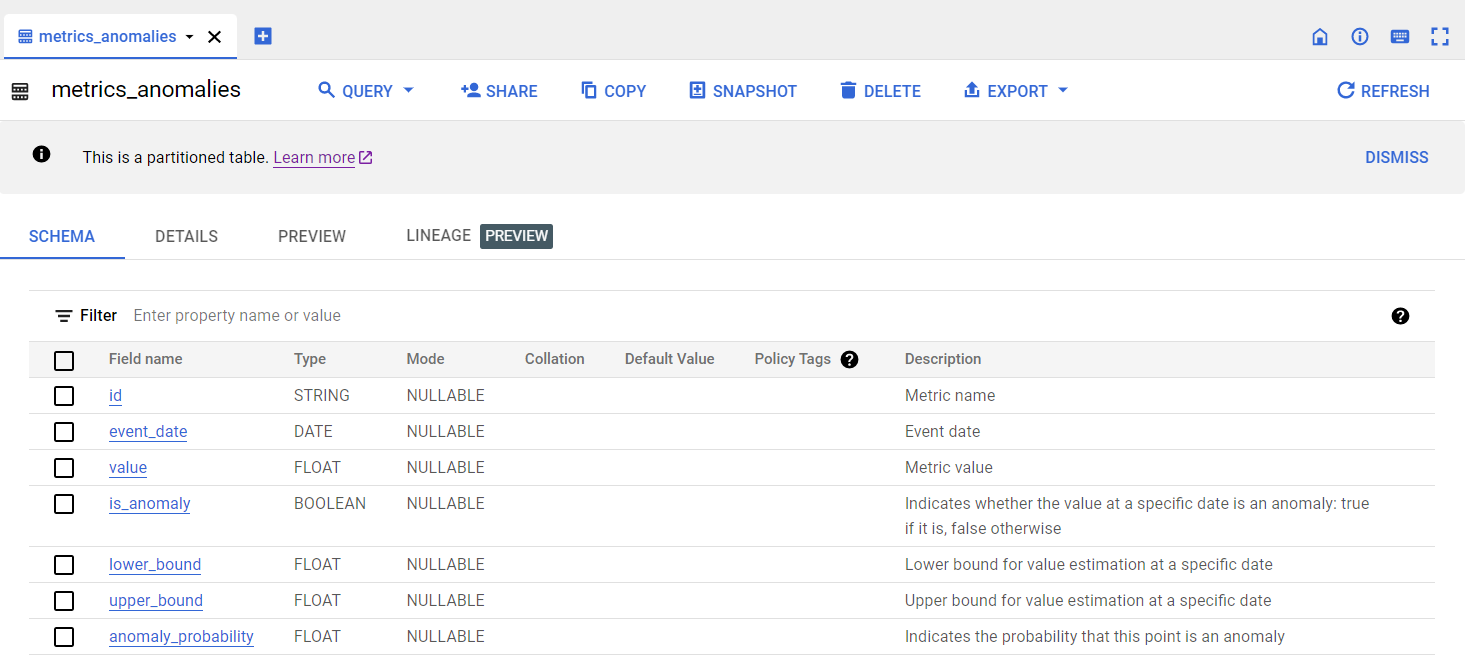
The data preparation and model training steps are in the pre_operations block. These steps will be executed before the final table creation. I set the type of the results of this file execution to a table partitioned by the event_date field, labeled with two labels, and tagged with a tag related to the query schedule. As a result of this query, you will have a table with the is_anomaly column indicating whether the value at a specific date is an anomaly or not:

Check if the most recent data points are anomalies
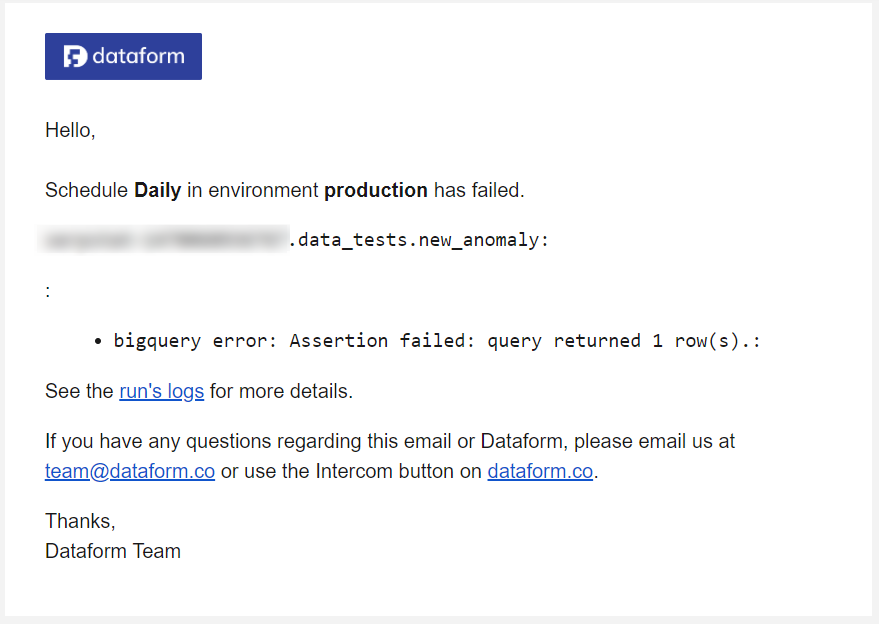
The final step is to create a separate Dataform SQLX file with the assertion. This assertion will fail if any metric in your data was an anomaly on a previous day. You can trigger an alert based on the results of this assertion:
config {
  type: "assertion",
  tags: ["1d"]
}

SELECT
  *
FROM
  ${ref("metrics_anomalies")}
WHERE
  event_date = DATE_SUB(CURRENT_DATE(), INTERVAL 1 DAY)
  AND is_anomaly = TRUE
For example, I get an email from the previous version of Dataform that operates outside of the Google Cloud Platform:

Then I can go to the dashboard in Looker Studio to visually check the anomaly:

Final thoughts
Now you have a simple mechanism for anomaly detection using BigQuery. This way you can check for anomalies in any data represented as a time series. It is just a basic setup, and you can build more complex pipelines on top of your data. Share your thoughts on this solution.
