As a product person you are usually trying to find a balance between time to market and amount of value delivered to your users. In other words, if something produces a lot of value and you don’t have to spend ages before you release it - you are good to go. Of course you should have some level of confidence in what you are going to do and raising up this level is a really good habit.
It would be very useful to know how your users feel about what you are going to release. That’s where the Kano model might be a tool to try. Briefly speaking, the Kano model can help you in prioritization and understanding how satisfying a feature is. You end up with a numerical score for each assessed feature or with one of categories (Performance, Attractive, Must-be, Indifferent, Questionable) in which the features fall in.
I recommend you to use a continuous version of the model. It gives more context to the results and does not hide the data distribution. The in depth guide on implementation of the Kano model is worth the separate article. But wait, this article already exists so I don’t have to write it :) Check it here.
Kano questionnaire
These are the three questions that you can use in the survey:
Functional question
How do you feel if {you have the feature}?
I like it
I expect it
I am neutral
I can tolerate it
I dislike it
Dysfunctional question
How do you feel if {you don’t have the feature}?
I like it
I expect it
I am neutral
I can tolerate it
I dislike it
Importance question
How important is it or would it be if {you have the feature}?
1 - Not at all
2
3 - Somewhat
4
5 - Important
6
7 - Very important
8
9 - Extremely important
Next you’ll have to assign a numerical value to all the text options to calculate mean and confidence interval for each question:
Functional question:
I like it ~ 4
I expect it ~ 2
I am neutral ~ 0
I can tolerate it ~ -1
I dislike it ~ -2
Dysfunctional question:
I like it ~ -2
I expect it ~ -1
I am neutral ~ 0
I can tolerate it ~ 2
I dislike it ~ 4
Options in importance question become just 1 to 9.
You can run the survey on your website using Hotjar + Google Tag Manager (GTM) as it gives a lot of flexibility with settings and triggers. A free version of Hotjar lets you create 3 surveys but you can’t import any external data to target the survey on the segments of your audience. GTM can help you with that if you are already pushing some information on your users to the data layer.
A side note on Hotjar. Sometimes it is easier to visually show what you are asking about. The text description becomes cumbersome in these cases. So you can try other tools that let you add some images to the questions. For instance, you can create surveys in Google Forms with some visuals.
How to analyze the results of Kano survey
For each question you calculate mean and confidence interval. If the mean with confidence interval falls into 0-4 range on functional and dysfunctional questions, then you can use this grid to categorise feature:
Functional 0-2, dysfunctional 2-4 - must-be
Functional 2-4, dysfunctional 2-4 - performance
Functional 2-4, dysfunctional 0-2 - attractive
Functional 0-2, dysfunctional 0-2 - indifferent
You can assume that must-be features are the most important because you lose users if you lack these. Performance features produce a lot of value to your users with every release. Attractive features have a wow-effect. And no one cares about indifferent features so they are just eating your resources.
0-4 intervals give you the strongest signals. If the results fall outside of this range, then try some additional methods to improve confidence. The edge case here might be when you get the opposite survey results from what you’re expecting. This happens when users don’t like what you offer so try to change functional question to dysfunctional and vice versa.
Real-life example
Lets say, you sell fruits and vegetables on your website. You are going to add 100 keywords to the Serpstat rank tracker and want to mark each one with fruits and vegetables categories. You can set these as tags in rank tracker and dive deeper into each of the categories while analyzing the positions of keywords or competitive landscape.
We got a bunch of requests from our users to add colors to tags to make them more visually appealing and distinguishable from other interface elements. Our confidence level for this feature was quite low so I ran a Kano survey to get more data on this.
I got 178 responses in total but only 83 with all three questions answered. I assume that it was related to survey settings that I used. The conversion rate to fully answered survey might be better if on the first step you somehow explain to users that you are going to ask three simple questions and appreciate it if they answer them all.
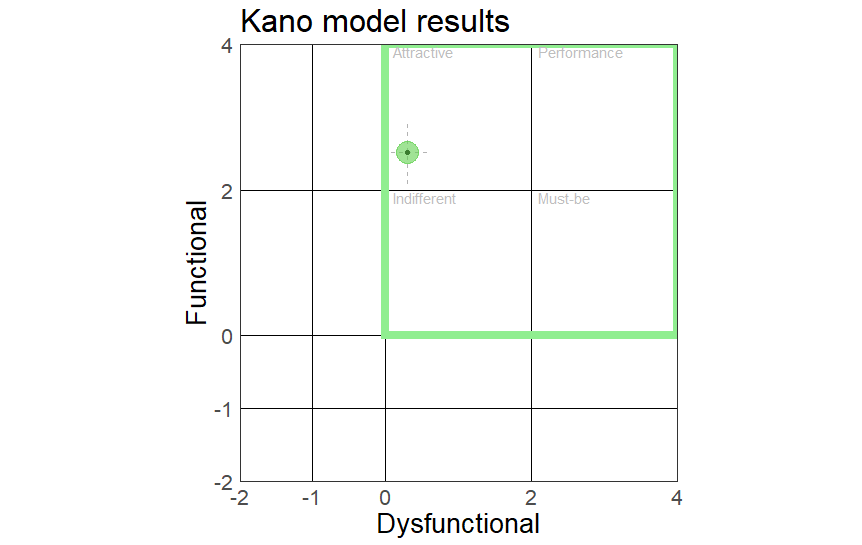
Here is the visual representation of the results on functional-dysfunctional scale with dashed line representing confidence interval, green square highlighting 0-4 range and a circle size as a function of mean importance:

In this example the feature fell into the attractive category and was quite important. This gave us more confidence in upcoming development and, voila - we have colored tags now. By the way, the first feedback that we got on this feature was something like “cool, already set some colors”. This aligns with the attractive category, but we need more time to collect post-release data on feature usage. A code to plot the survey data in R In case you would like to play with this plot, here is the R code that I use to analyze survey results:
# Load packages.
if(!('pacman' %in% installed.packages())) {install.packages('pacman')}
packages_load <- c('tidyverse')
pacman::p_load(packages_load, character.only = TRUE)
pacman::p_loaded()
packages_temp <- c()
packages_temp <- packages_temp[!packages_temp %in% pacman::p_library()]
if(length(packages_temp) > 0) pacman::p_install(packages_temp,
                                                character.only = TRUE)
rm(packages_load, packages_temp)

# Functions.
get_mean_ci <- function(values, name, confidence_level = 0.05) {
  # Calculates confidence interval.
  #
  # @param values (required) A vector with data points.
  # @param name (required) The prefix for column names in results.
  # @param confidence_level (required) F confidence level for confidence interval
  #   calculation.
  # @return Returns tibble with mean and confidence interval.
  # @examples
  #   get_mean_ci(values = c(1:10), name = 'test', confidence_level = 0.05)

  data_size <- length(values)
  data_mean <- mean(values)
  data_sd   <- sd(values)

  data_error <- qt(1 - confidence_level / 2, df = data_size - 1) * data_sd / sqrt(data_size)
  data_ci    <- tibble(
    min   = data_mean - data_error,
    mean  = data_mean,
    max   = data_mean + data_error
  )
  data_ci <- data_ci %>%
    rename_all(~paste0(name, '_', names(data_ci)))

  return(data_ci)
}

# Set grid points for question options and plot grid.
grid_points <- c(-2, -1, 0, 2, 4)

# Load data from Hotjar export file and transform data from text to numbers.
hj_data_path <- '/path/to/hotjar/results.csv'

hj_data <- read_csv(hj_data_path) %>%
  na.omit() %>%
  select(ends_with('?')) %>%
  mutate_all(~ sub(' -.*', '', .)) %>%
  rename_all(~ c('functional', 'dysfunctional', 'importance')) %>%
  mutate(
    functional = case_when(
      functional == 'I like it'         ~ grid_points[5],
      functional == 'I expect it'       ~ grid_points[4],
      functional == 'I am neutral'      ~ grid_points[3],
      functional == 'I can tolerate it' ~ grid_points[2],
      functional == 'I dislike it'      ~ grid_points[1]
    ),
    dysfunctional = case_when(
      dysfunctional == 'I like it'         ~ grid_points[1],
      dysfunctional == 'I expect it'       ~ grid_points[2],
      dysfunctional == 'I am neutral'      ~ grid_points[3],
      dysfunctional == 'I can tolerate it' ~ grid_points[4],
      dysfunctional == 'I dislike it'      ~ grid_points[5]
    ),
    importance = as.integer(importance)
  )

# Calculate confidence intervals.
poll_data <- bind_cols(
  get_mean_ci(values = hj_data$functional,    name = 'functional'),
  get_mean_ci(values = hj_data$dysfunctional, name = 'dysfunctional')
) %>%
  add_column(importance = mean(hj_data$importance))

# plot results.
poll_data %>%
  ggplot(aes(x = dysfunctional_mean, y = functional_mean)) +
  geom_point() +
  geom_segment(
    aes(
      x    = dysfunctional_mean,
      xend = dysfunctional_mean,
      y    = ifelse(functional_min < grid_points[1], grid_points[1], functional_min),
      yend = ifelse(functional_max > grid_points[5], grid_points[5], functional_max)
      ),
    alpha    = 0.3,
    linetype = 'dashed'
    ) +
  geom_segment(
    aes(
      x    = ifelse(dysfunctional_min < grid_points[1], grid_points[1], dysfunctional_min),
      xend = ifelse(dysfunctional_max > grid_points[5], grid_points[5], dysfunctional_max),
      y    = functional_mean,
      yend = functional_mean
      ),
    alpha    = 0.3,
    linetype = 'dashed'
    ) +
  geom_point(
    aes(x = dysfunctional_mean, y = functional_mean),
    size  = poll_data$importance * 2,
    color = poll_data$importance,
    alpha = 0.6,
    ) +
  geom_hline(yintercept = grid_lines) +
  geom_vline(xintercept = grid_lines) +
  geom_rect(
    xmin  = grid_points[3],
    xmax  = grid_points[5],
    ymin  = grid_points[3],
    ymax  = grid_points[5],
    fill  = NA,
    color = 'lightgreen',
    size  = 3) +
  annotate(
    'text',
    x     = c(grid_points[3], grid_points[4], grid_points[3], grid_points[4]) + 0.1,
    y     = c(grid_points[5], grid_points[5], grid_points[4], grid_points[4]) - 0.1,
    label = c('Attractive', 'Performance', 'Indifferent', 'Must-be'),
    hjust = 0,
    color = 'grey'
    ) +
  scale_x_continuous(
    limits = c(grid_points[1], grid_points[5]),
    expand = c(0, 0),
    breaks = grid_points
    ) +
  scale_y_continuous(
    limits = c(grid_points[1], grid_points[5]),
    expand = c(0, 0),
    breaks = grid_points
    ) +
  coord_fixed() +
  theme_bw() +
  theme(axis.ticks = element_blank(), panel.grid = element_blank(), text = element_text(size = 20)) +
  labs(x = 'Dysfunctional', y = 'Functional', title = 'Kano model results')
As a conclusion
I would like to hear your thoughts on this method of raising confidence level. Do you have any tools or frameworks to do that? Share it with me in the comments.