Update. I updated this article with a new case of BigQuery cost optimization.
One of my responsibilities as a product manager is tracking the influence of product on key metrics like revenue or MRR. I also prefer to share this data with my team for us to be on the same line while we are developing new features or improving something that already exists. A dashboard with a number of key metrics is good choice here.
We use Google BigQuery as an analytics data warehouse so everyone in the team is able to get all the data using SQL queries. Cloud database for analytics is a huge advantage. We do not need to build any infrastructure and support it. Also we do not spend our time on getting data from different sources.
To build dashboards for key metrics I usually use Google Data Studio. It has a native connector for BigQuery so I just write a query or choose a table and all the data is there. While I was building a dashboard for the life was beautiful and shiny. Everything looked simple and perfectly working until I’ve found some weird behaviour of Data Studio.
How Google Data Studio makes requests to BigQuery
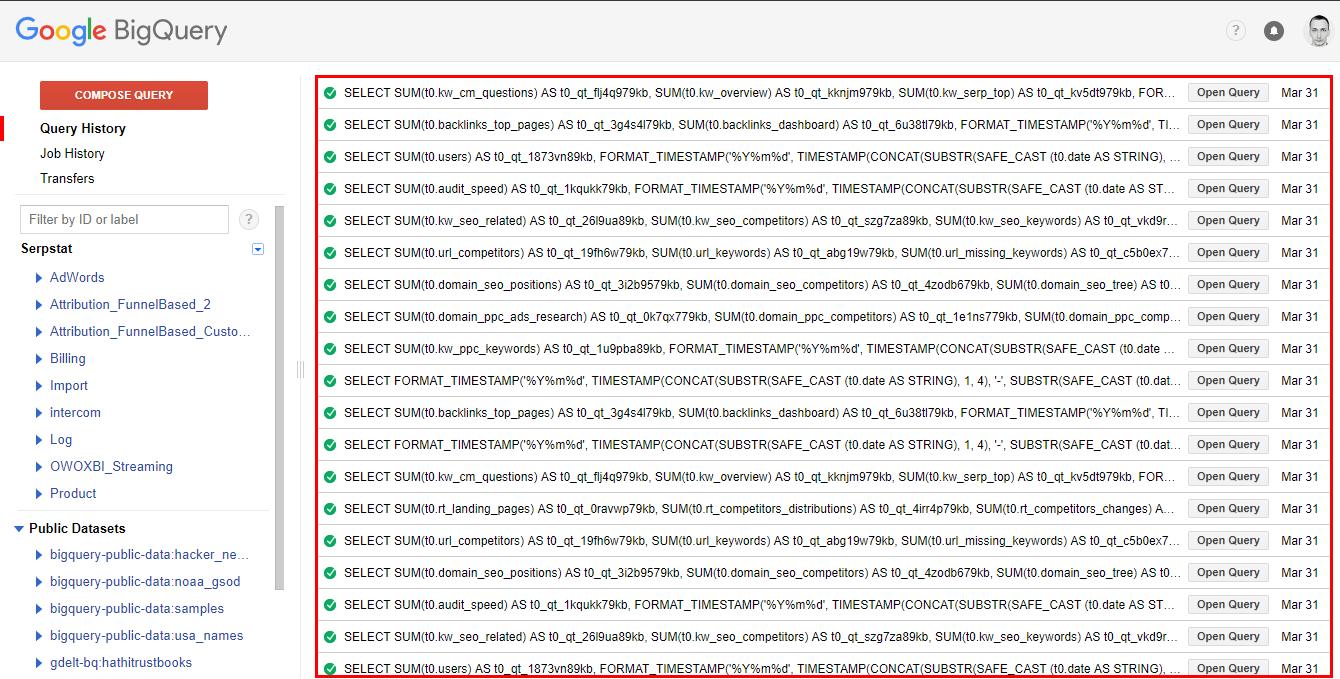
Let’s go to BigQuery UI and see what happened. I was very surprised when I saw that Data Studio makes separate requests for every single plot if I use custom query as a connection type. I have twelve plots in my dashboard so instead of one query I see twelve. It might also happen several times per day:

I expected that Data Studio would make one request to get aggregated data and then use it a source for all plots. So I went to Google Cloud Console to check resources consumption and look through the logs. All the suspicious requests were made by my account but I usually do not write the code like this:
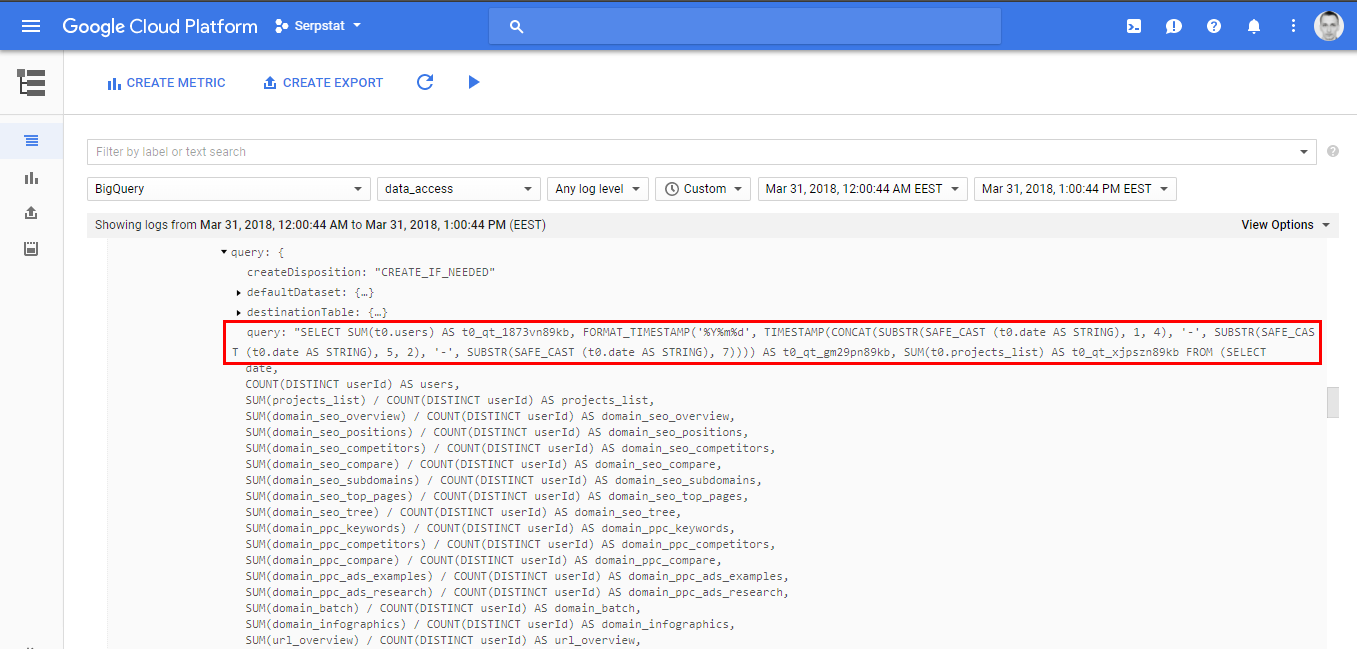
The only source for such requests was Data Studio. Why is this important? Because BigQuery is a paid product. You pay for data storage and data processing while querying tables. There is a free tier and if you exceed it the price is not so high but for those who like SELECT * it is not the best choice.
In BigQuery if you make the same requests multiple times the result is cached and is charged only for the first time. But Data Studio makes different requests to build every plot in my case and does not use cached results. So I had to build some solution that utilizes cache and reduces the cost of queries.
Using separate table to store aggregated results
My first attempt was to use a view based on custom request. But it didn’t work because Data Studio made different request to that view and the problem was the same. So my next idea was to save the results of the query to separate table. Also I wanted to update that table daily to get fresh data to the dashboard.
After playing a little with BigQuery UI and digging through documentation I’ve realised that there is no way to natively schedule the execution of the query. I had to build my own solution so Mr Google helped me again to find what I was looking for. Armed with this great article, a little knowledge of Apps Script and BigQuery API documentation I’ve wrote this code:
function runQuery() {

  var configuration = {
    "query": {
    "useQueryCache": false,
    "destinationTable": {
          "projectId": "my_project_id",
          "datasetId": "my_dataset_id",
          "tableId": "my_table_id"
        },
    "writeDisposition": "WRITE_TRUNCATE",
    "createDisposition": "CREATE_IF_NEEDED",
    "allowLargeResults": false,
    "useLegacySql": false,
    "query": "SELECT * FROM `my_project_id.my_dataset_id.my_view_id`"
    }
  };

  var job = {
    "configuration": configuration
  };

  var jobResult = BigQuery.Jobs.insert(job, "my_project_id");

  Logger.log(jobResult);

}
Here I select all records from the view my_view_id based on my custom query and write aggregated results to my_table_id table. Both are stored in my_dataset_id dataset in my_project_id project. I scheduled execution of this script using time based trigger to ran daily between one and two AM:
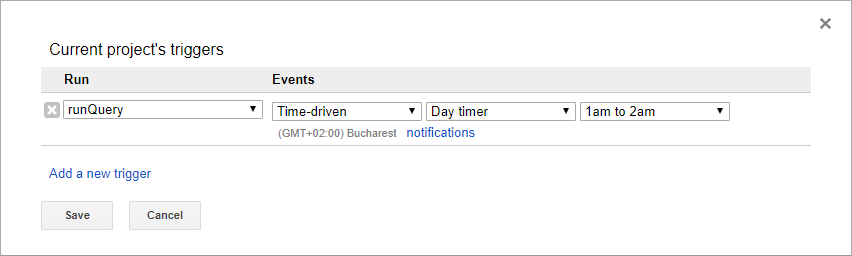
And voila - the size of separate table is 12 KB. It is updated daily and only one request is made to aggregate raw data using view. I use this table as a data source for my fancy dashboard in Data Studio and sleep well. The total reduction in billed queries is proportional to the number of plots. For me it was twelve times, for you it might be even bigger.
BigQuery costs optimization use case
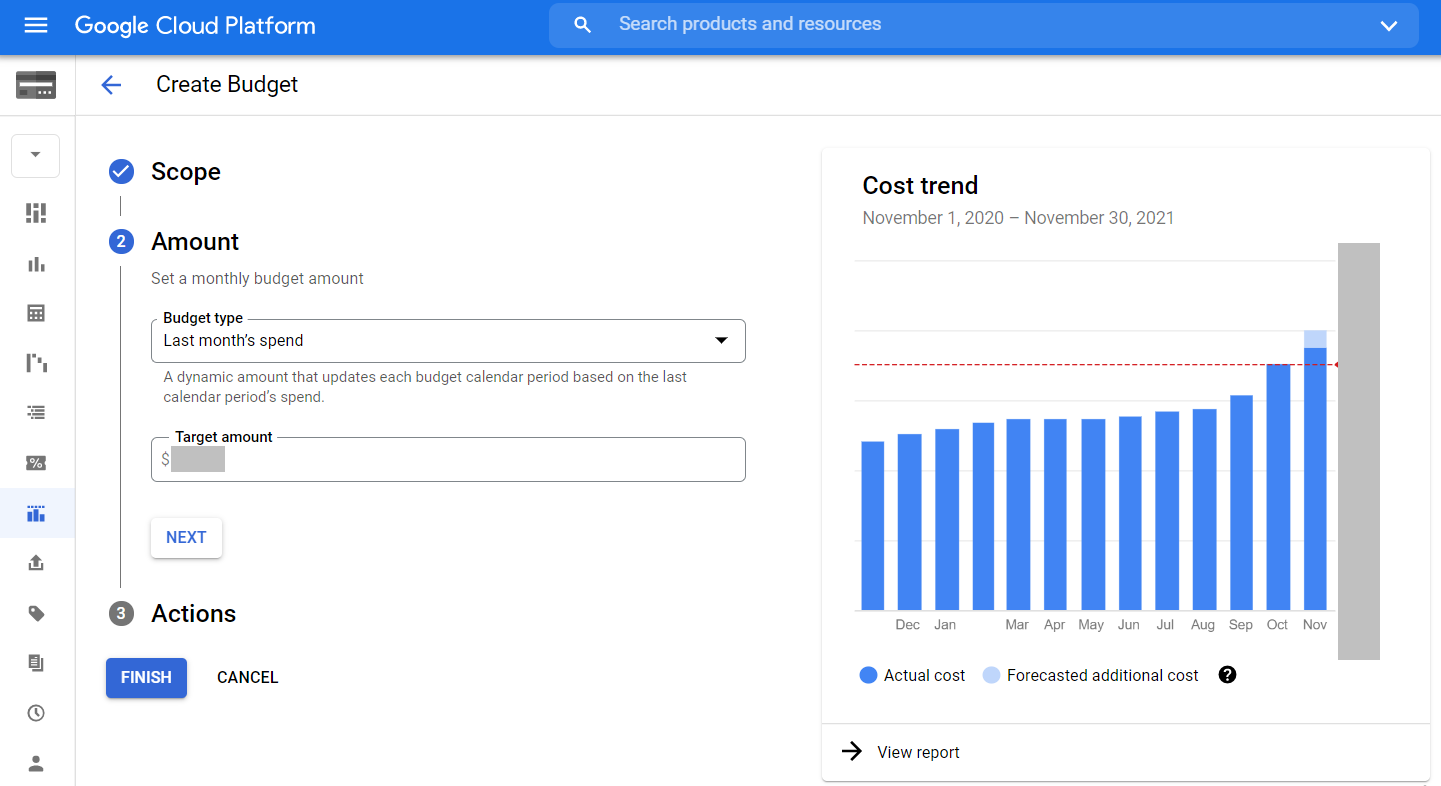
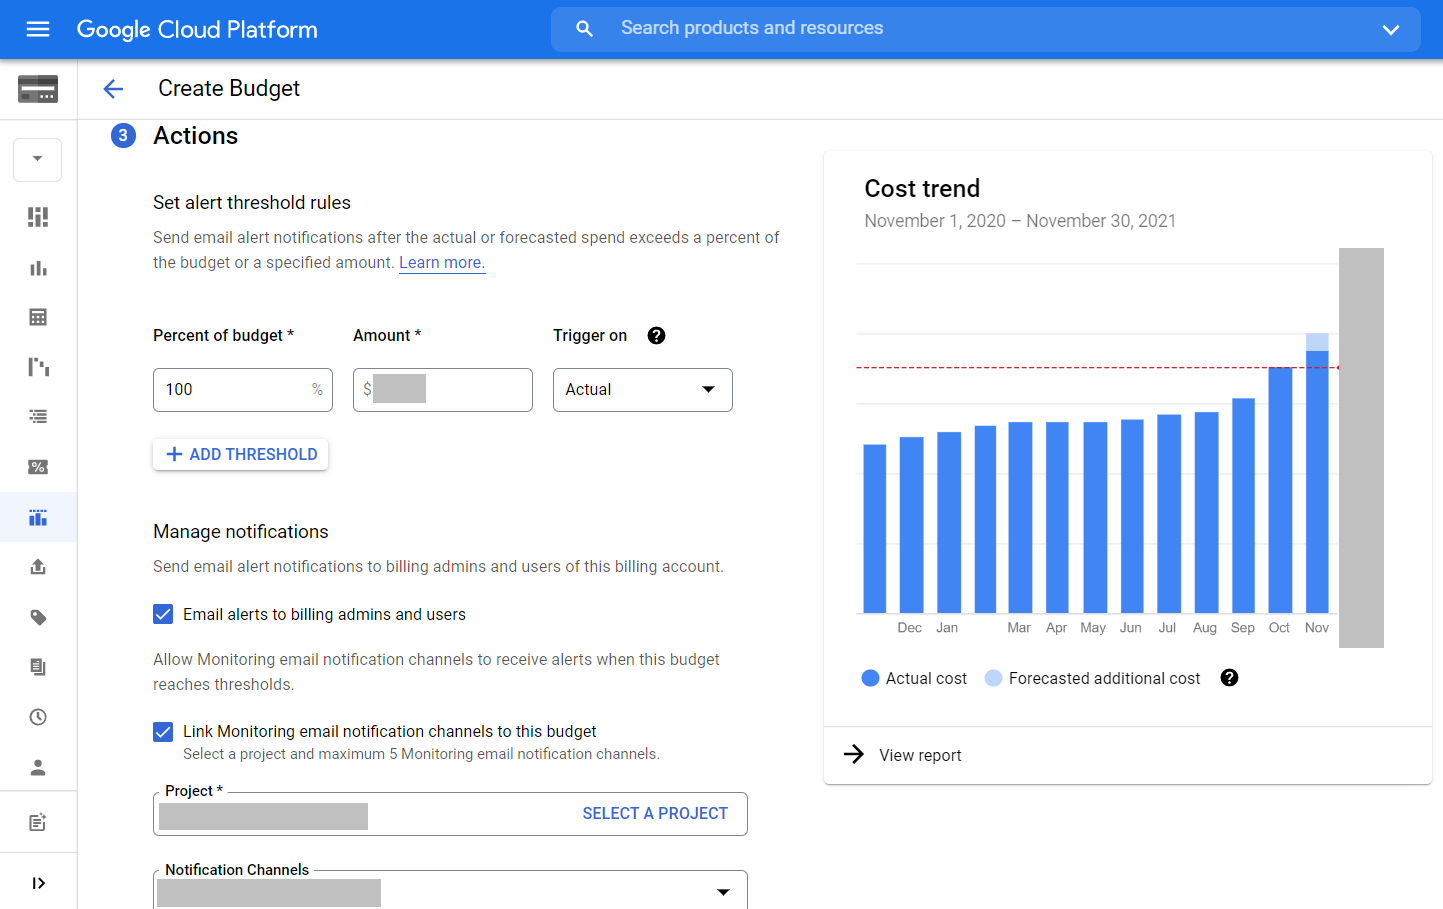
Here is another investigation that I did to optimize BigQuery costs related to Data Studio. One of the must have features related to cost control in Google Cloud Platform is budget alerts. You can set it up in Billing - Budgets & alerts in GCP. I’ve created new monthly budget alert for entire billing with following settings:
So if the previous month budget is reached I get an email like this:
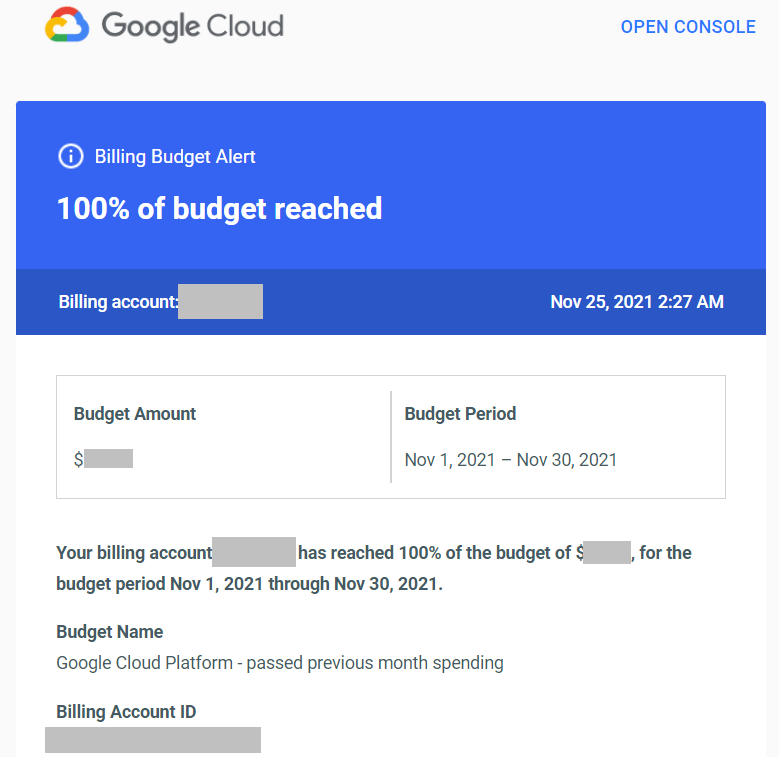
Usually I expect to get this email in the last two days of month as the amount of GCP resources that we use is constantly growing. But this time there were another five days in the month so I considered this as anomaly.
First of all I checked the cost distribution between our two projects connected to the same billing account. I build this plot in Billing - Reports:
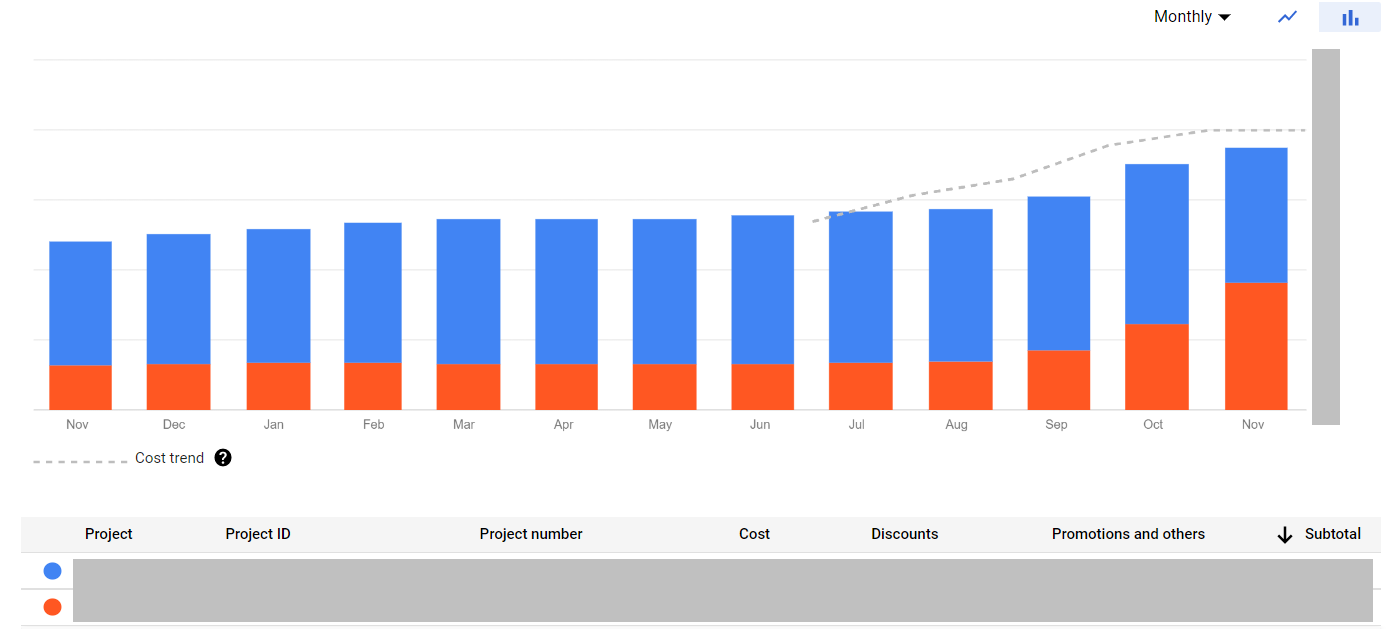
Something definitely happened in the orange project as the cost increased significantly related to the previous month. Using the same report I drilled down to the cost structure of current month in this project:
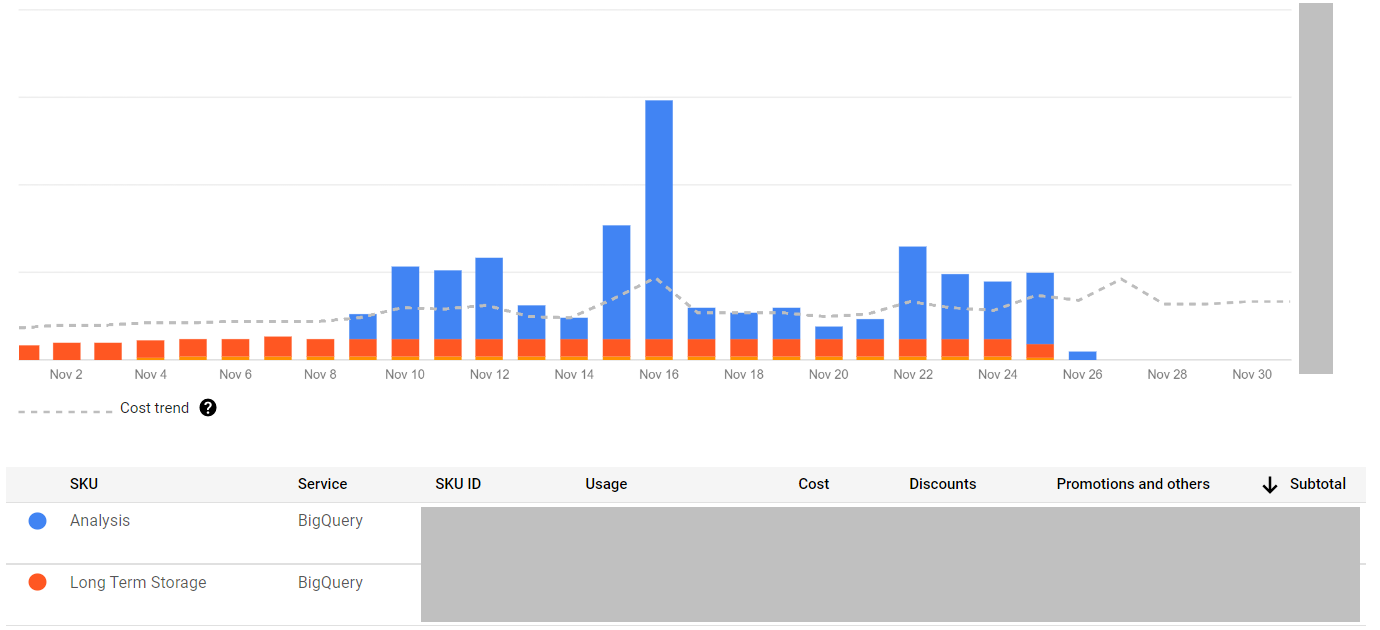
The amount of data stored in BigQuery remained the same but the amount of data processed while querying tables raised to the sky. I was not aware of any drastic changes in queries consumption that might lead to this. So I checked the logs in Logging - Logs Explorer with protoPayload.serviceData.jobQueryResponse.job.jobStatistics.totalBilledBytes and protoPayload.authenticationInfo.principalEmail summary fields and this query:
resource.type="bigquery_resource"
protoPayload.methodName="jobservice.query"
severity=INFO
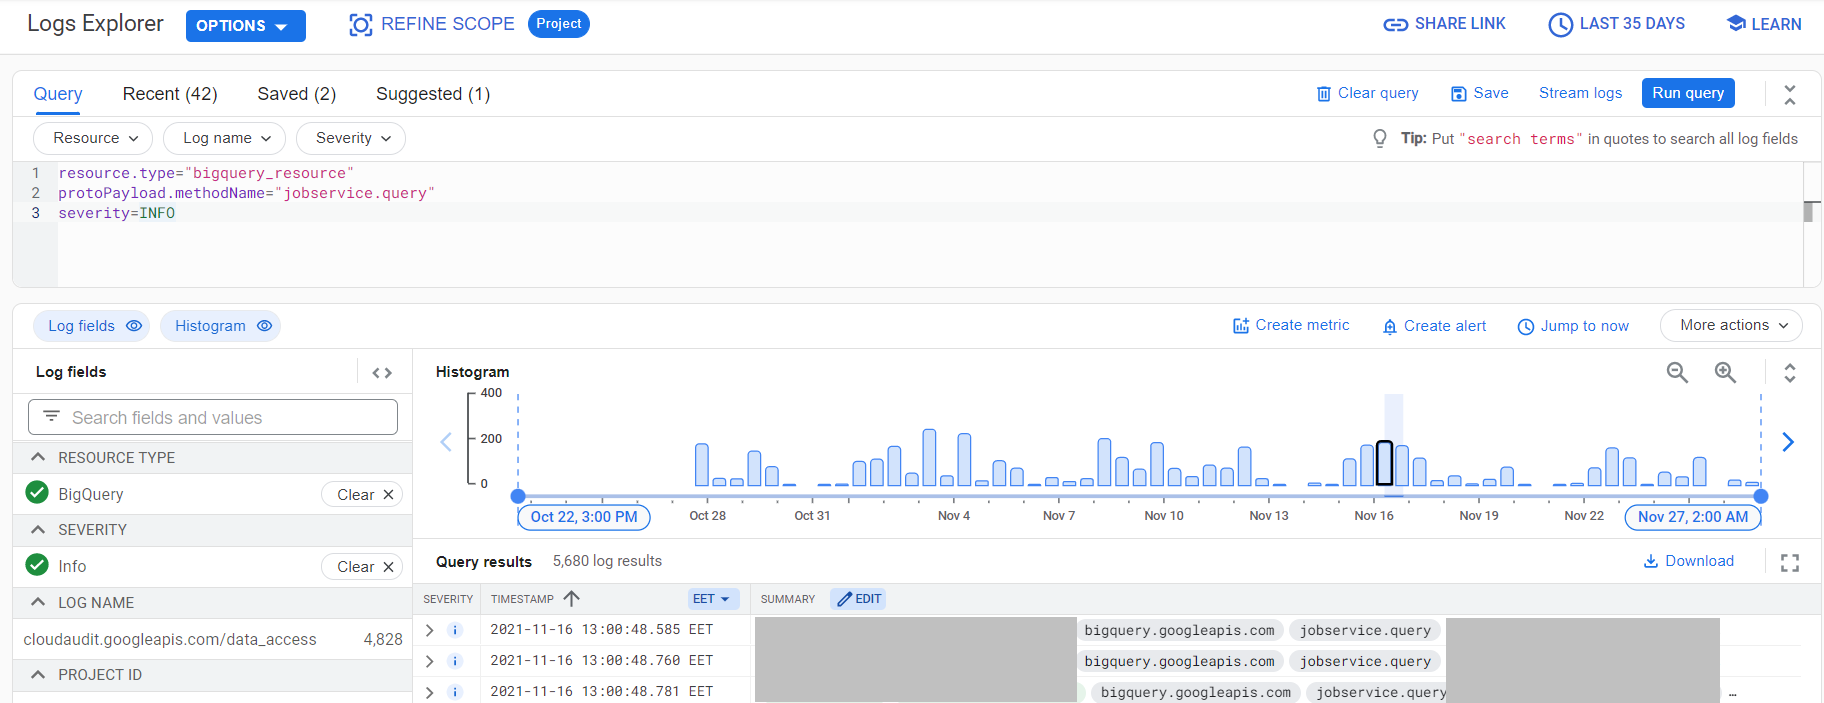
I got a bunch of users who were making a lot of similar queries many times per day. This was definitely not the expected behavior and the queries looked pretty similar to what I saw in other cases while working with Data Studio:
SELECT * FROM (
SELECT clmn0_, clmn1_, SUM(clmn3_) AS clmn100000_, SUM(clmn3_) AS clmn100001_, SUM(clmn11_) AS clmn100002_, SUM(clmn11_) AS clmn100003_, SUM(clmn12_) AS clmn100004_, SUM(clmn8_) AS clmn100005_, SUM(clmn12_) AS clmn100006_, SUM(clmn9_) AS clmn100007_, SUM(clmn8_) AS clmn100008_, SUM(clmn9_) AS clmn100009_ FROM (
SELECT * FROM (
SELECT t0.CampaignName AS clmn10_, t0.CampaingType AS clmn0_, t0.Clicks AS clmn8_, t0.Cost AS clmn12_, t0.Date AS clmn6_, t0.Impressions AS clmn9_, t0.source AS clmn1_, t0.transactionRevenue AS clmn3_, t0.transactions AS clmn11_ FROM (
select *
from {dataset_name}.{table_name}
where
proj_name = "{some_name}"
) t0
) WHERE ((clmn6_ >= DATE "2021-11-01") AND (clmn6_ <= DATE "2021-11-30") AND (STRPOS(clmn10_, "{parameter}") > 0))
) GROUP BY clmn0_, clmn1_
) LIMIT 20000000
The most horrible part of this query is select * in the inner most part. The queried table was not clustered nor partitioned. So all the data from the table was fully scanned with each and every request from Data Studio. This was the reason for uncontrolled cost growth.
With a clustered and partitioned aggregated table on top of such a table you can reduce the cost because the there will be no full scan of the table. The aggregation can be built using scheduled query as it allows you to append new data to existing tables on a regular basis:
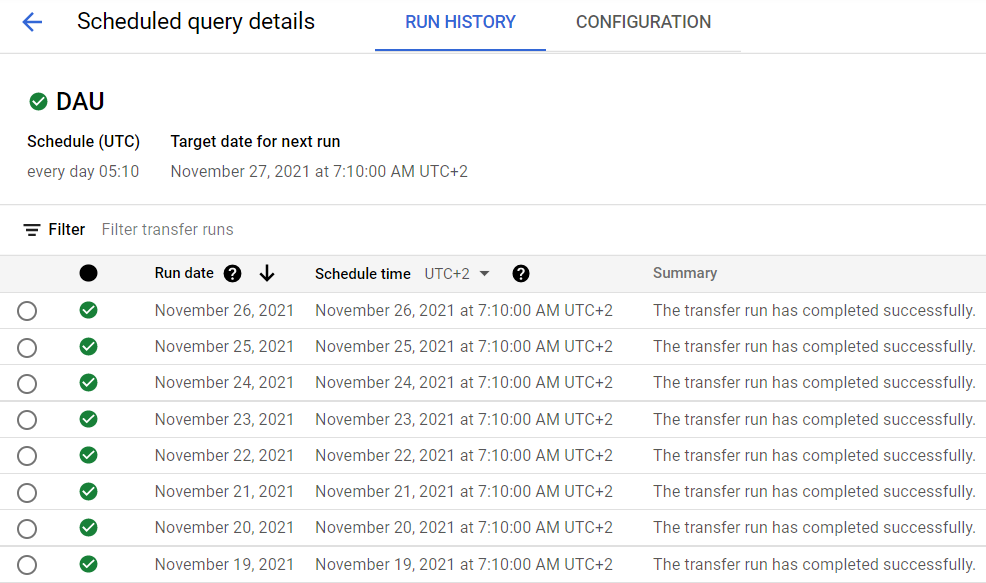
You can also use materialized views. Check the benefits of both methods here.
In the end I want to share some useful links if you are new to BigQuery:
Any kind of better solutions are highly accepted.